Electric Vehicle (EV) Market Analysis
A deep dive into EV sales trends, key manufacturers, and future projections (2022-2024).
Description
The Electric Vehicle (EV) industry has seen rapid transformation over the past few years, driven by technological advancements, government policies, and shifting consumer preferences.
Technologies Used
Power BI Desktop, Power BI Service, Excel, MySQL
Market Overview & Key Measures
2M
Total EVs Sold (2022-2024)
57M
Total Vehicles Sold
3.61%
EV Penetration Rate
93.91%
EV CAGR (Growth Rate)
54.21M
Projected EV Sales for 2030
Top and Bottom EV Manufacturers (2-Wheelers)
| Rank | Manufacturer | Sales (FY 2023-24) | Category |
|---|---|---|---|
| 1 | Ola Electric | 475K | Top Performer |
| 2 | TVS | 263K | Top Performer |
| 3 | Ather Energy | 184K | Top Performer |
| 8 | Battre Electric | 4.84K | Bottom Performer |
| 9 | Jitendra EV | 8.56K | Bottom Performer |
| 10 | Kinetic Green | 9.56K | Bottom Performer |
EV Penetration Trends Across India
Top 5 States with Highest EV Penetration in FY 2024:
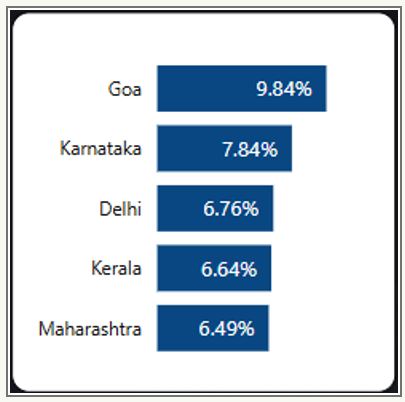
These states lead in EV adoption due to strong government policies, infrastructure, and urban adoption rates.
States with Declining EV Penetration Growth (2022-2024):
Some states that had an early mover advantage have struggled with increasing competition and changing market preferences. The lack of continuous infrastructure expansion has also contributed to the decline.
Seasonal Sales Trends
Sales peak in Q3 and Q4 (October–March) due to major Indian festivals such as Diwali and New Year.
Q1 and Q2 (April–September) generally witness slower sales, making it necessary for companies to implement alternative marketing strategies.
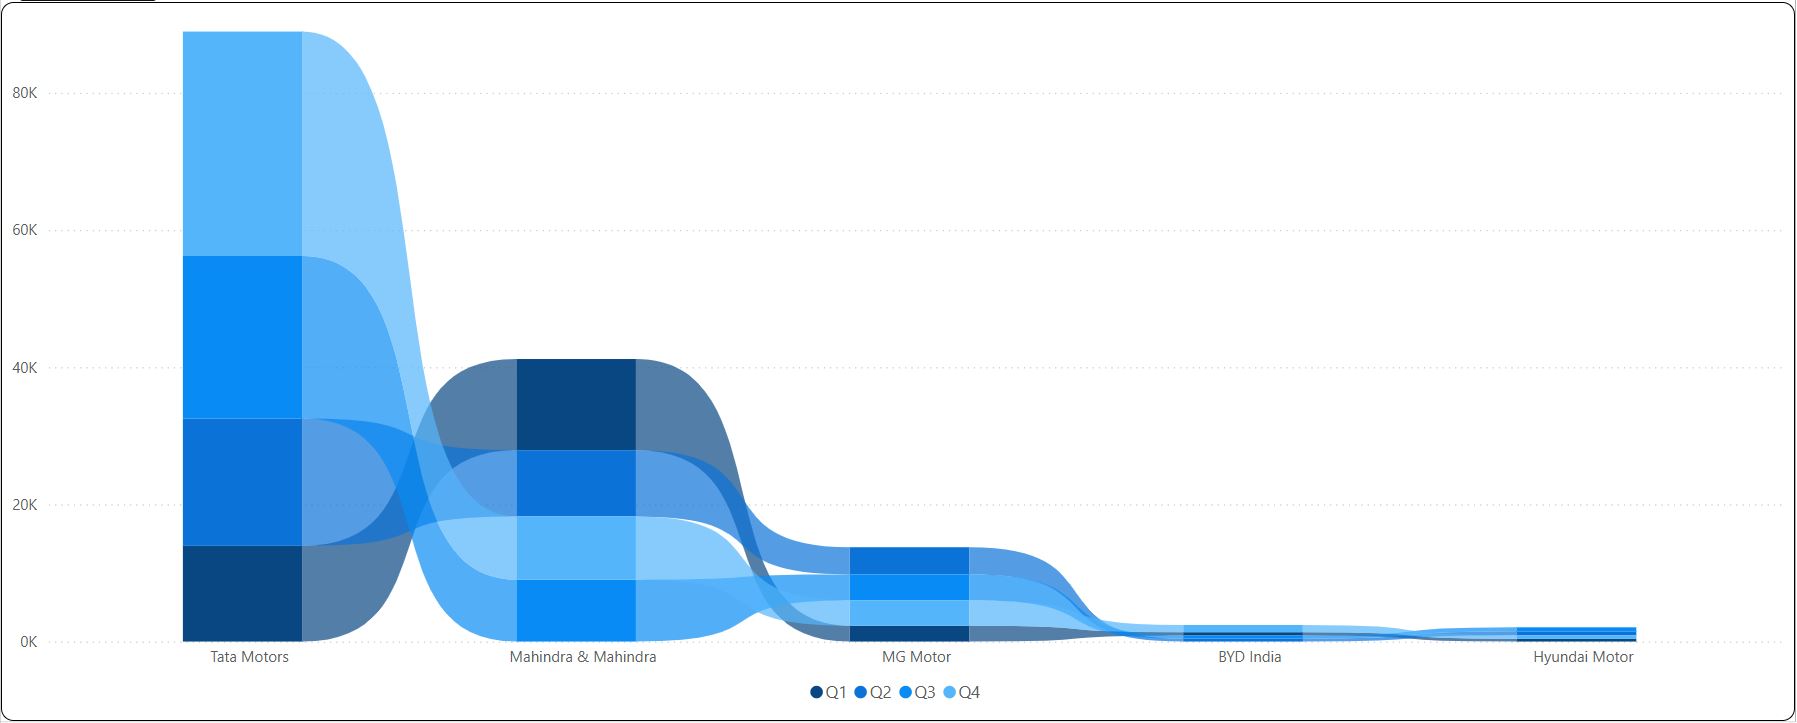
Manufacturers should optimize their sales and marketing strategies to align with these trends for maximum impact.
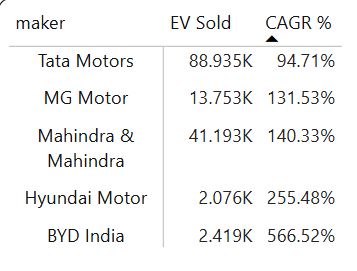
Top 5 EV Makers (4-Wheelers) – CAGR Report
Certain 4-wheeler manufacturers have achieved significant growth by focusing on battery technology, affordability, and after-sales services.
Additionally, the Top 10 states with the highest CAGR in EV sales (2022-2024) offer promising expansion opportunities.
Key Business Insights & Recommendations
- Strong Growth Potential: Invest in Goa, Karnataka, and Delhi.
- Seasonality: Maximize sales efforts in peak months.
- Competitive Landscape: Ola Electric dominates, while Hero Electric struggles.
Conclusion
The EV industry is experiencing rapid growth, requiring companies to adapt strategically. Investments in infrastructure and battery innovation will be key.
Live Demo
Explore the interactive EV Dashboard for in-depth insights.